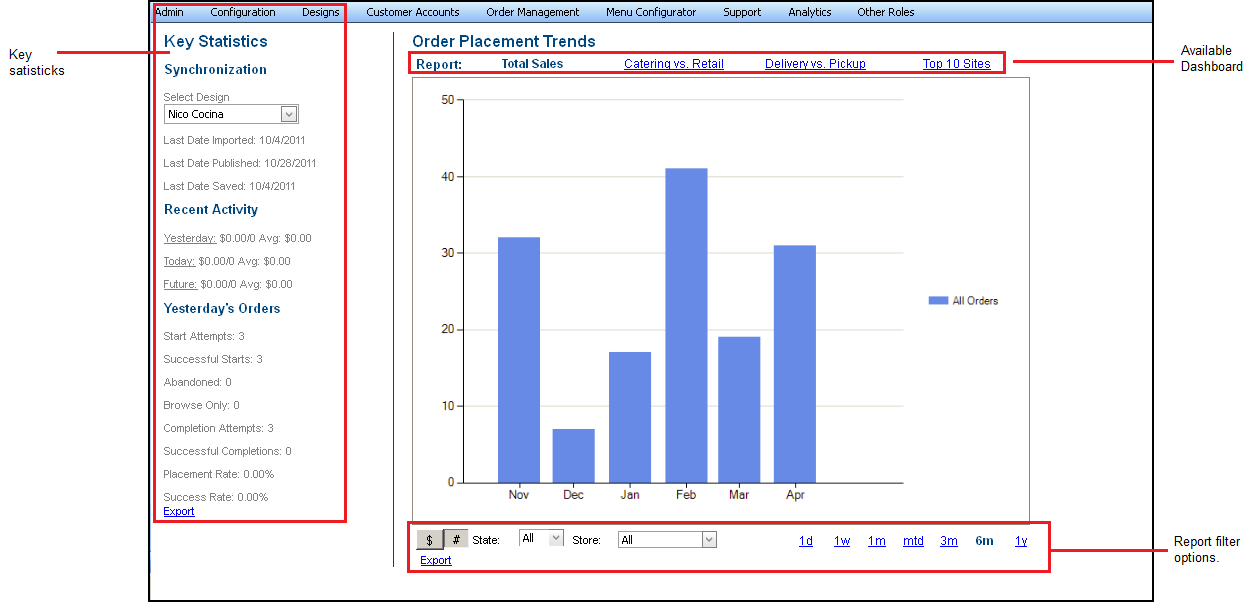
Analytics and reports are essential in gauging the progress of your restaurant and determining the success or failure of your business. In a corporation, reports provide an important link from the store level to corporate. The Company Dashboard and Reports options enable you to review online ordering transaction data for your company, for specific site locations, and to identify your top consumers and items for order.
Working with Company Dashboard
Company Dashboard enables you to view the data concerning your online ordering site and provides you with information to help you evaluate the effectiveness of your online ordering site. For example, if you see a high percentage of abandoned order attempts, you may want to review your menu setup.
In Web Admin, access the Company Dashboard at Analytics > Company Dashboard.

The Company Dashboard contains three sections: Key Statistics, Reports, and filter options.
The options for the available dashboard reports, located at the top of the screen, include:
| Total Sales | Displays the totals sales according to your filter selections. |
|---|---|
| Catering vs. Retail | Displays a comparison between catering and retail according to your filter selections. Use the information to evaluate your sales by menu. |
| Delivery vs. Pickup | Displays a comparison between pickup and delivery orders according to your filter selections. Use the information to evaluate your sales by order mode. |
| Top 10 Sites | Displays the top 10 sites based on sales count according to your filter selections. |
The key statistics, located on the left side of the screen, include the following:
| Column | Description |
|---|---|
| Synchronization | Details the date of the last design import, the last time you published the design, and the last time you saved the design. |
| Recent Activity | Summarizes the total sales and the average sale for the previous day, current day, and all future orders. |
| Yesterday’s Orders | Summarizes the following: - Start attempts - Successful starts - Abandoned - Browse only - Order errors - Completion attempts - Successful completions - Placement rate - Success rate |
The filter options, located at the bottom of the screen, include:
| Filter | Description |
|---|---|
| $ or # | Filter the report by total online order sales, or by the total number of online orders |
| State | Select a specific state by which to filter the report. |
| Store | Select a specific store by which to filter the report. |
| Time frame | Select a time frame by which to filter the report. Options include one day (1d), one week (1w), one month (1m), Month to date (mtd), three months (3m), six months (6m), and one year (1y). |
You can export the dashboard information by clicking Export. An export link appears on both Key Statistics and the filter options.