Campaign Sales report
The Campaign Sales report is located in the Report Catalog. This report allows you to view sales and reward metrics by campaign, including both loyalty and non-loyalty campaigns.
Tip: You must have an Account Group selected or applied to your user to view all of the reports.
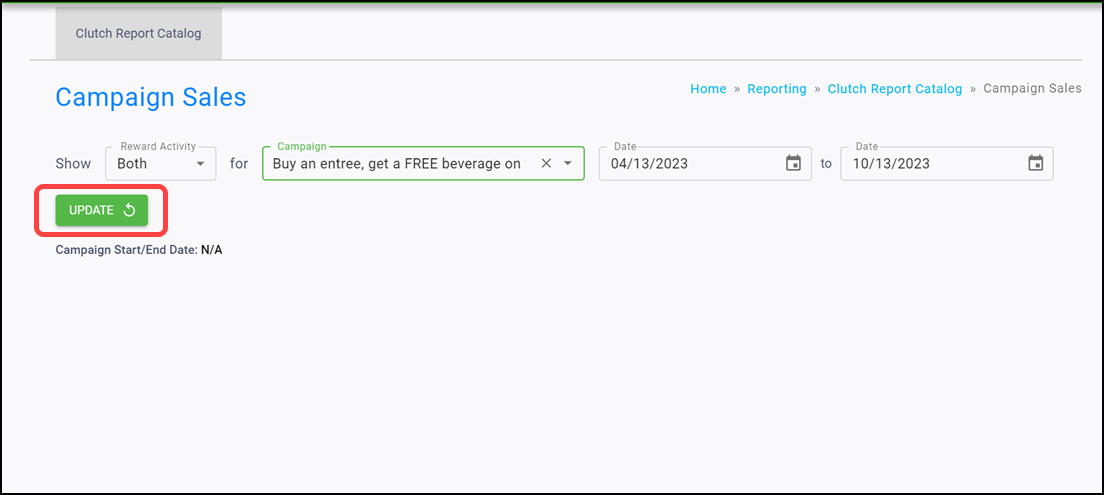
Filters
You can target specific data within your report by using the available filters on top. These filters include:
Reward Activity
Filters the transactions based on whether a reward was earned, burned, or both, with the default selection being both.
Campaign
Allows you to select any campaign that includes a checkout rule. Type within the box to search for a campaign. The results get more defined as you type out the campaign name.
Date range
Allows you to filter based on the transaction date. You can select start and end dates, with the default selections spanning the last six months.
Once the desired filters are in place, click Update to update your report.
Info boxes
You can view a variety of different metrics using the info boxes within the Campaign Sales report.
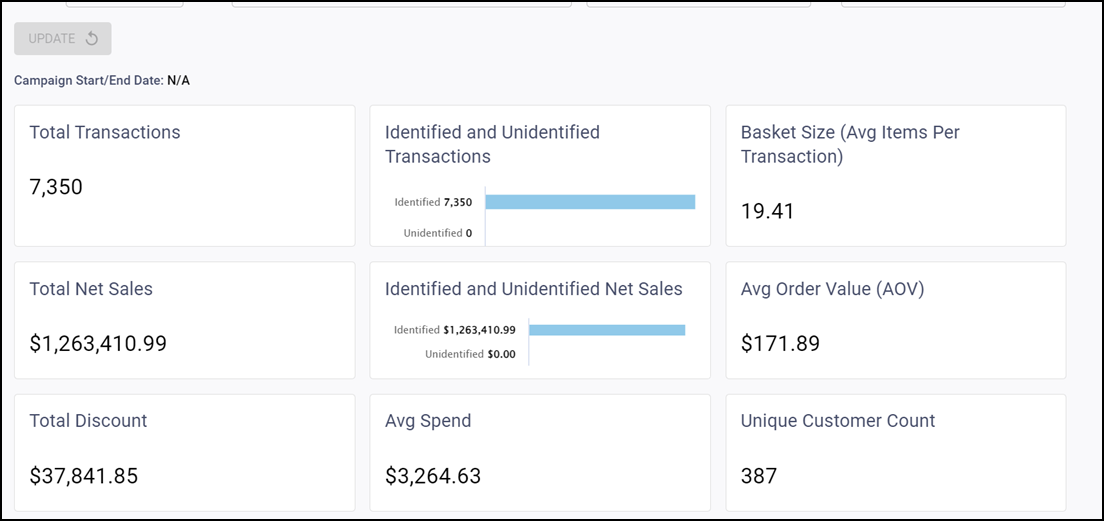
Total Transactions — Shows the total purchases minus voids.
Identified and Unidentified Transactions — Shows the total identified and unidentified transactions. Identified transactions are those that are tied to a card; whereas, unidentified transactions are those that are not tied to a card.
Basket Size (Avg Items per Transaction) — Shows the total number of purchase items divided by the total transactions.
Total Net Sales — Shows the total amount minus voids and discounts.
Identified and Unidentified Net Sales — Shows the total identified and unidentified sales. Identified sales are those that are tied to a card; whereas, unidentified sales are those that are not tied to a card.
Avg Order Value (AOV) — Shows the total net sales divided by total transactions.
Total Discount &mash; Shows the total amount of discount applied to transactions where this campaign triggered.
Avg Spend — Shows the total net sales divided by the unique customer count.
Unique Customer Count — Shows the unique count of customers who participated in this campaign.
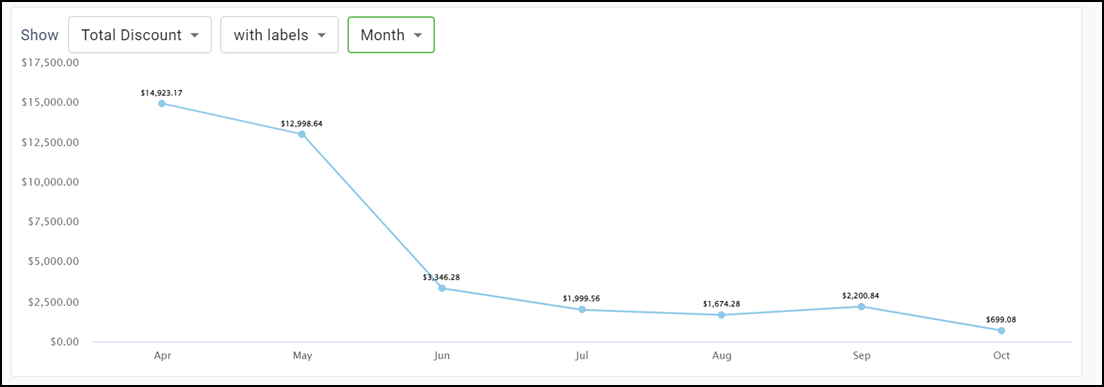
Trend chart
The line graph shows various campaign metrics over time. You can alter the time period, as well as show the information with or without labels.
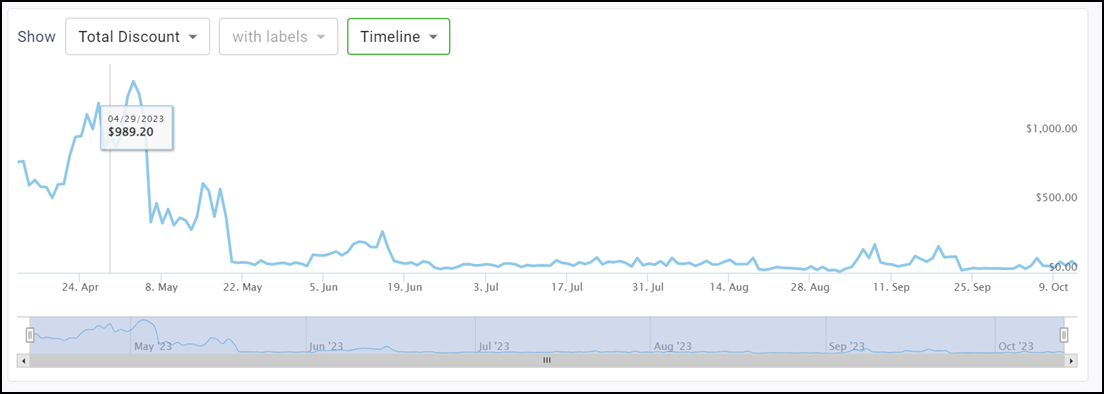
You can view the following metrics:
- Total Transactions
- Basket Size (Avg Items per Transaction
- Total Net Sales
- Avg Order Value (AOV)
- Total Discount
- Unique Customer Count
Notes: This chart defaults to show total transactions.
Timespan drop-down list
Determines the timespan of the chart. You can toggle between Timeline, Month, or Day of Week. Read below to learn more about these timespan options.
Timeline — Displays a trend over time chart that plots metrics by day. Use the bar on the bottom of the chart to zoom in or out to different date ranges on the timeline. All data for the selected date range will be displayed. If more than a year is chosen in the Date Range picker, the Timeline option will be disabled and the graph will default to the Month view.
Month — Displays a trend over time chart that summarizes metrics by month.
Day of Week — Displays a stacked column chart that breaks metrics out by the day of the week and time of day.
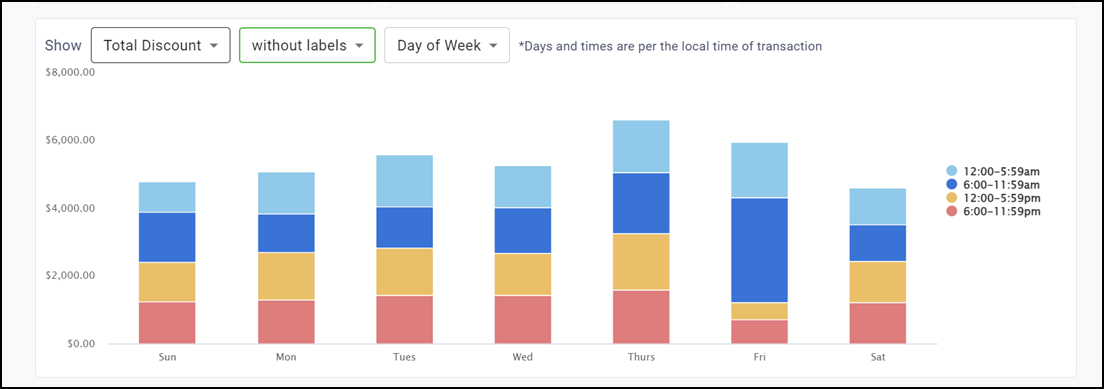
Note: The system assigns metrics to the time-of-day groupings according to the local time of the transaction. For example, if you have locations in both New York and Los Angeles with transactions that occur at 8 a.m. local time for each location, the system assigns both to the 6:00-11:59 a.m. group.
Labels
Use the labels drop-down to toggle between showing labels on the graph or not. Selecting 'with labels' displays a more detailed graph containing labels. Selecting 'without labels' displays a cleaner graph.
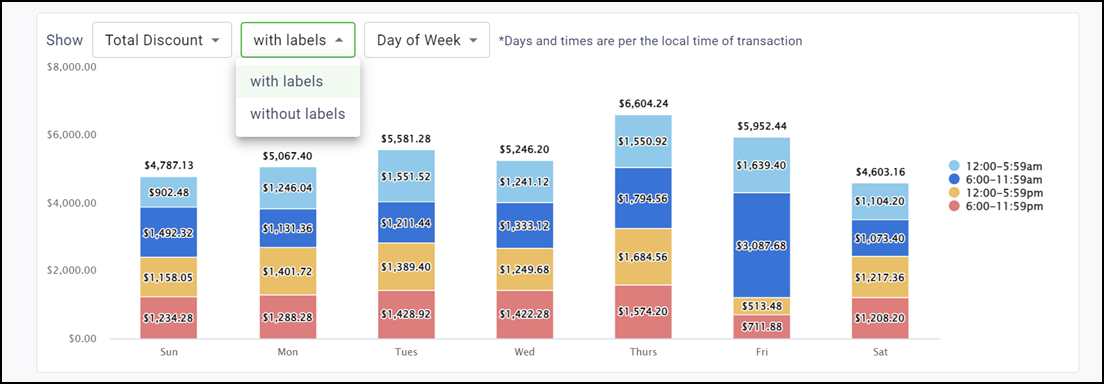
Note: This feature is disabled for the Timeline version of this graph.
Reward table
The Reward Table displays the Reward Type, Issued Amount, and Redeemed Amount for campaigns that issue a non-discount reward.
The Redeemed Amount does not show for campaigns that use universal banking rewards like points or punches that are part of your overall loyalty program. This is because redemption cannot be tied back to the specific campaign from which they were originally issued.
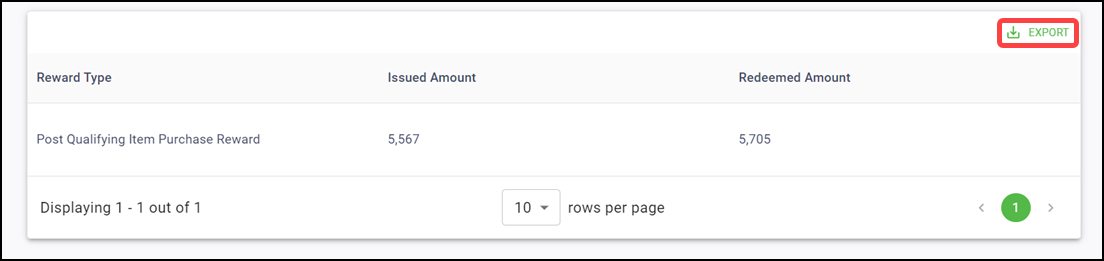
Note: Click EXPORT in the top right corner to download the table results as a CSV. You can temporarily rearrange table columns by holding click on the column header and dragging to the left or right. These changes pass through to the export and reset when you reload the page.