User Navigation and Interactions
Viewing details
From any widget, to view report details, follow these steps:
-
Click on the slice of the bar graph or hover over it
-
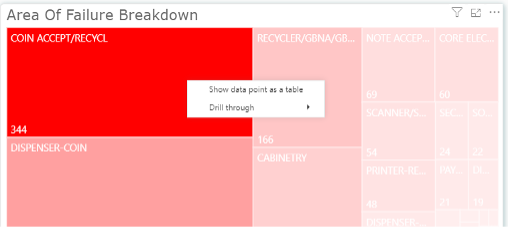
Right click
With right click you can view these choices:
-
Show data points as table or
-
Drill through (to view report details)

Figure 3. Screenshot Area of Failure widget - Options when hovering over
- Filter
- Focus Mode
- Spotlight
- Export Data
- Sort axis (sort descending & sort ascending)