Viewing the Sales Dashboard
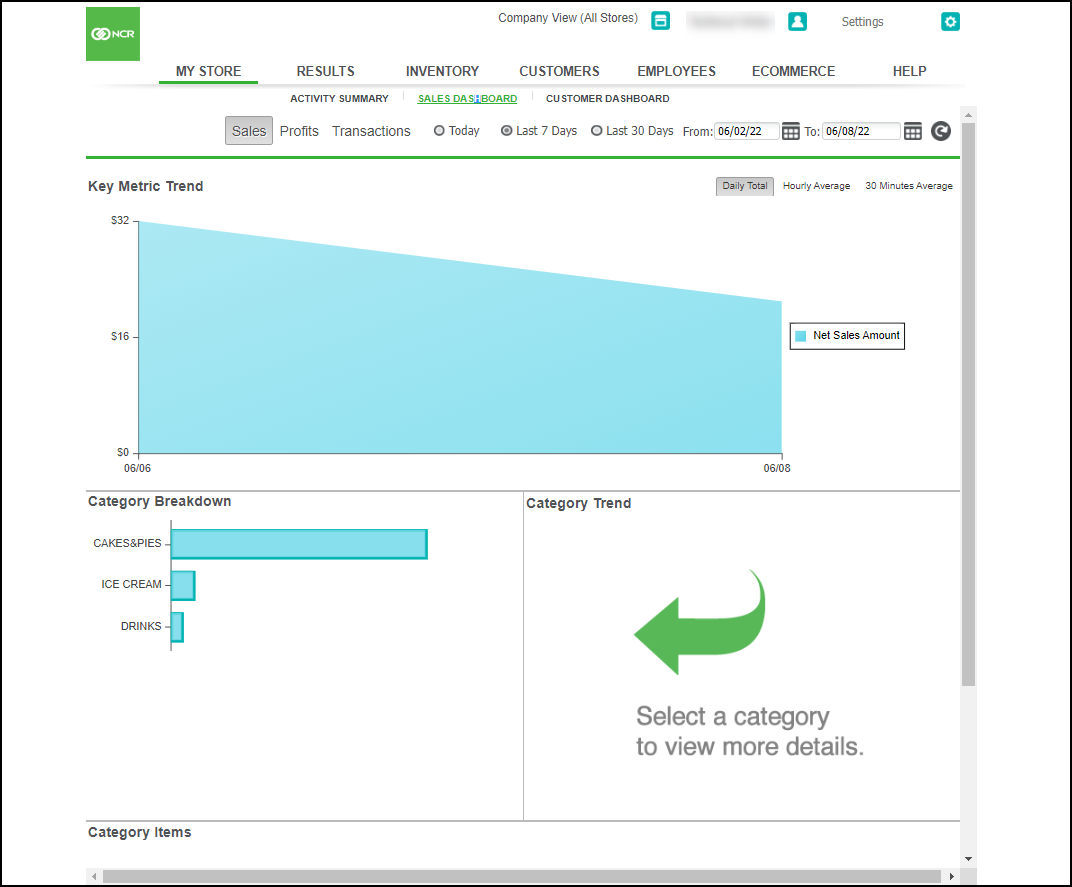
Use MY STORE > SALES DASHBOARD to view a real-time snapshot of your sales, including net sales, by category and by item, for your restaurant.

Filter — Allows you to view a snapshot of your business by sales, or transactions, and select a time period to review.
Key Metric Trend — Displays the results of the selections you made in the filter. Additionally, you can opt to review your data by daily total, hourly average or 30 minutes average.
Category Breakdown and Category Trend — Displays the results for each category and ranks the categories from highest to lowest according to your filter. Select a category to display a plot line to the right in Category Trend for the selected time period and metric.
Category Items — Provides a further analysis of your sales, enabling you to review the best and worst selling items within each category. You can sort each column to assist you with your analysis.
Looking for resources or help with Silver? Click here.