Incident Visualization
Where do I view Incident KPI and SLA performance?
On the left side pane, click Incident Management and then open Incident Dashboard under it, or just click on the Incident Dashboard widget from the Home page.
This dashboard provides visibility into SLA performance of all KPI.
Available widgets:
- Open/ Resolved Incidents
- Incidents by Status
- Issue Type
- Resolver Group
- Trending Incidents
- Asset Type
- Priority
- Top Locations
- Component
- Count by Age
- Break -up by Channel
- Map view
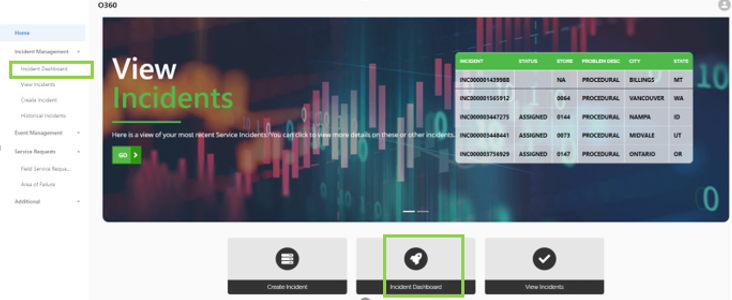
Figure 13. Incident Dashboard on Home page
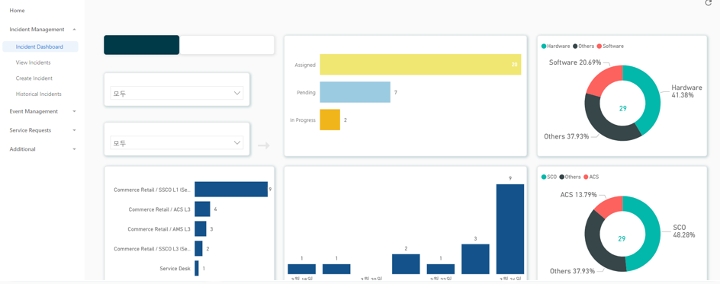
Figure 14. Incident Dashboard from left-hand pane
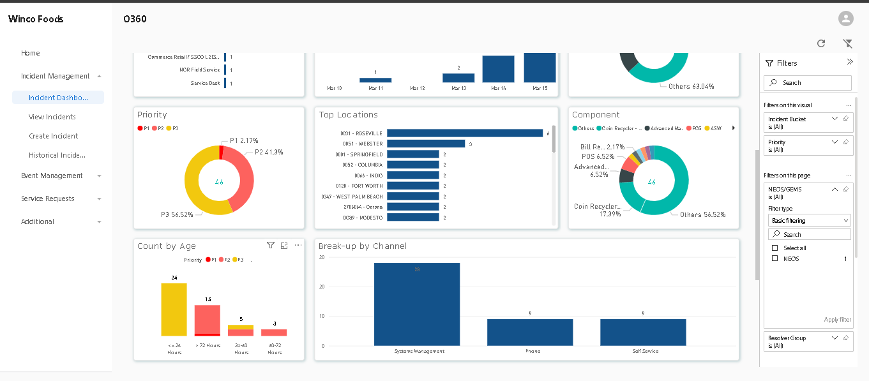
Figure 15. Incident view by Priority, Resolution, Channel, Age, Top Locations, Component
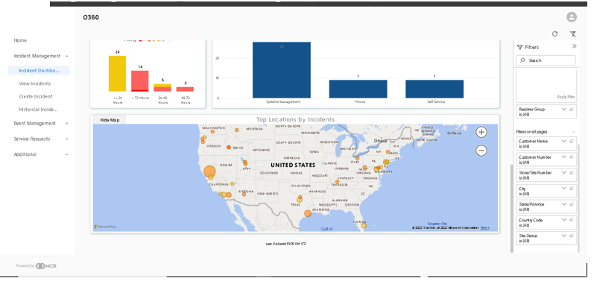
Figure 16. Incident view by Territory
How do I see historical reports on incidents?
On the left side pane, under tab Incident Management, click on subtab Historical Incidents.
On the top of the page, you have filters to specify the type of incident views, and you can select a period. You can choose to view x last days, weeks, months, years.
Filters:
- Open/Resolved
- Country
- Date
- Incident ID
You have access to the following widgets:
- Incidents by Product Category
- Incidents by Asset Type
- Incidents by Component
- Incidents by Location
- Incidents by Channel
- Daily Trending of Incidents
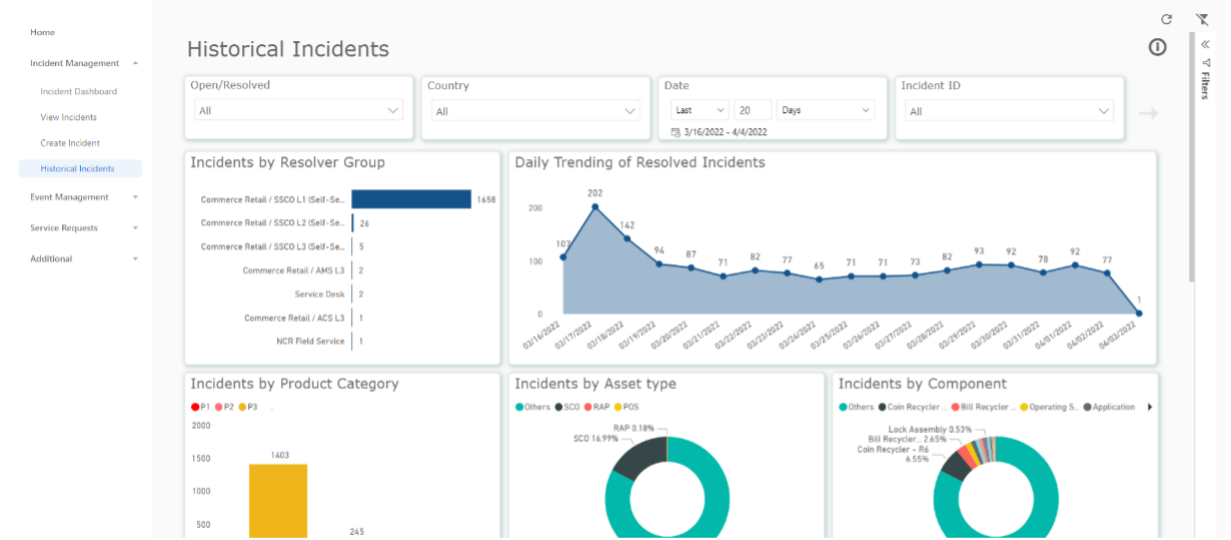
Figure 17. Historical Incident Option on Right-hand pane, Filters, Trends
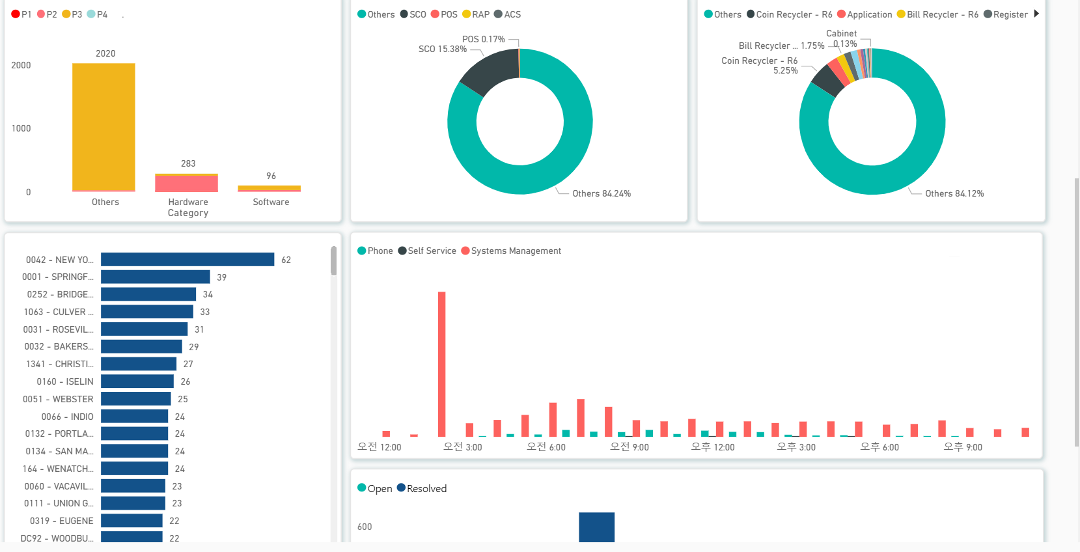
Figure18. Historical Incident View Widgets
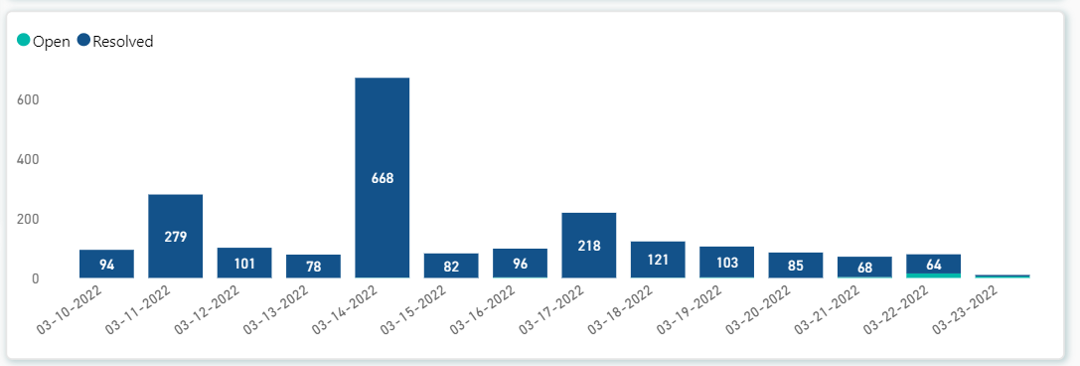
Figure 19. Historical Incidents View: Open vs. Resolved