Working with the dashboard
The dashboard appears on the landing page when you sign in to Aloha Smart Manager, if available for your user profile, and provides an 'at-a-glance' view of the performance of your restaurant. The data generated on the dashboard is from the period selected from the calendar start and end options for the currently selected site. Each time you sign in, the data from the previous day appears by default. The data appears as a graphical line chart and interactive widgets.
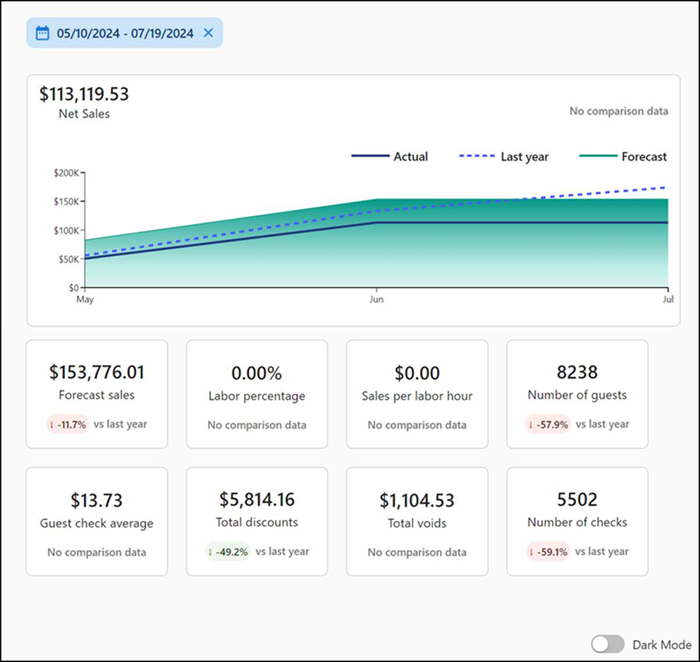
The following widgets help you navigate to a specific report or screen:
Changing the date to report
The dashboard displays data for the previous day, by default; however, you can switch to another date or select multiple dates to appear.
To change the dates to view on the dashboard:
- With the dashboard active on the screen, select the start and end dates to view. Alternatively, you can select the start and end dates from the predefined date range picker (Yesterday, Last 7 days, Last 14 days, and Last 90 days) to generate data for the corresponding number of days.
- Click Done. The screen refreshes to reflect the data for the selected dates.
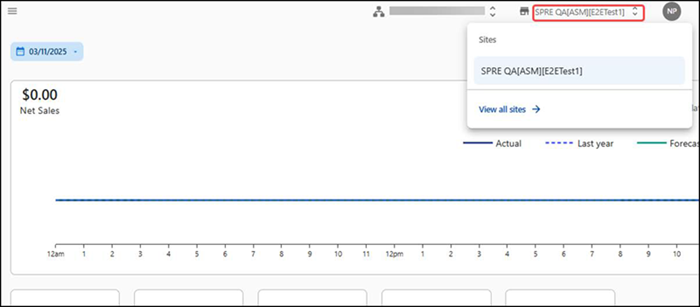
Changing the site
The dashboard displays for the default site assigned to you. If you use a multi-store account, you can easily switch from one site to another to view data and perform tasks within that site.
- With the dashboard active on the screen, click the displayed site. The 'Sites' popup appears with the currently selected site appearing first in the list.
- If needed, click View all sites. A 'Sites' search box appears allowing you to search for the site you need or select from the list that appears.
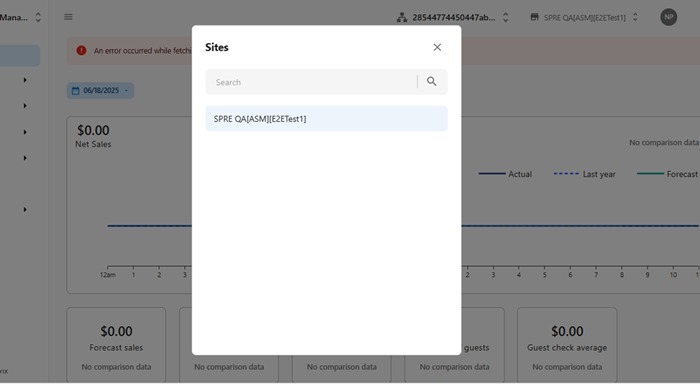
- If needed, type the site name in 'Search' to narrow the list or select a site from the drop-down list. The dashboard refreshes to display the data for the selected site.
Return to "Getting started with Aloha Smart Manager," or continue to "Working with your account."