Product mix
The 'Product mix' report allows you to view the sales of different products and sorts the highly sold products in the given data. This provides a clear picture of the sales in the selected time frame.
The 'Product mix' report offers two views:
- Menu items
- Employee sales
Menu items view

To run the Menu items view:
-
Select Sales > Report > Product mix > Menu items tab. The Menu items view appears with the previous date selected by default.
-
Select one or multiple sites from the drop-down list.
-OR-
Click Select all Sites to view report for all sites.
-
Click Reset to reset the site selection.
-
Select a date range from the drop-down list.
-
Select a category from the drop-down list.
-
Select an item to report from the drop-down list.
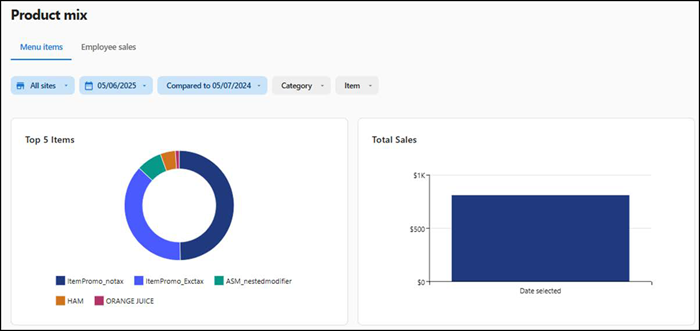
The report dynamically updates with each selected parameter. Reporting data appears on the following tiles.
- Top 5 items — Displays data in a circle with different colors displaying each item with a color. Hover over areas of the circle to view the sales data of the item.
- Total Sales — Displays data as a line graph on the axes showing the sales along with days/months/years, based on the date range selection. Hover over the line graph to show the net sales and item count of the selected range along with the comparison range.
Select List modifiers with item sold, to view the modifier quantity details of the respective category.
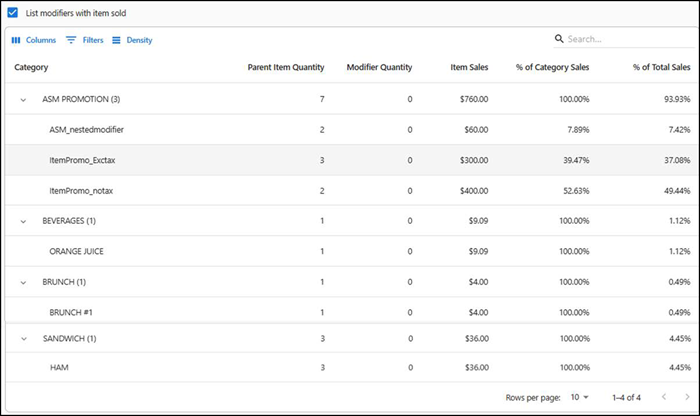
The data in the table appears with the following information:
| Column | Description |
|---|---|
| Category | Specifies the category of the item in which it is listed. |
| Sold quantity | Displays the count of all menu items sold, excluding modifiers. |
| Modifier quantity | Displays the count of all the modifiers sold. |
| Item Sales | Displays the total amount of item sales. |
| % of Category | Displays the percentage of parent item category sales to which the item belongs. |
| % of Total Sales | Displays the percentage of total sales the item represents. |
Note: You can sort the items by clicking the pivot(>) next to each item of the first three columns. Clicking the pivot gives you detailed sales data of each item sold and also modifier data sold accordingly.
Employee sales view
To run the Employee sales view:
-
Select Sales > Report > Product mix > Employee sales tab. The Employee sales view for the previous date appears by default.
-
Select the site to report from the drop-down list.
-OR-
Click Select all Sites to view report for all sites.
-
Click Reset to reset the site selection.
-
Select a date range to report from the drop-down list.
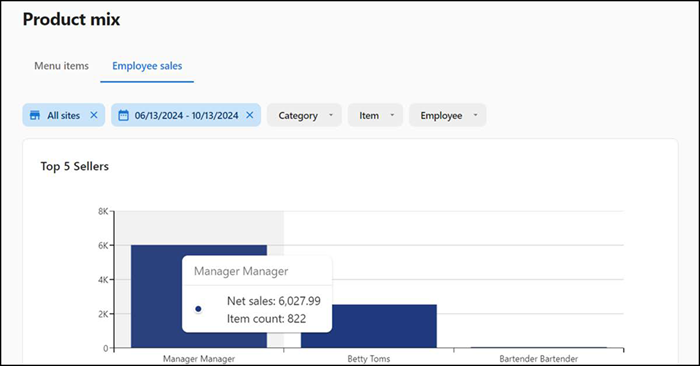
The report dynamically updates with each selected parameter. Reporting data appears on the following tile:
Top 5 sellers — Displays the net sales amount in the form of bars for the top 5 employees. Hover over the bar to show the net sales and item count.
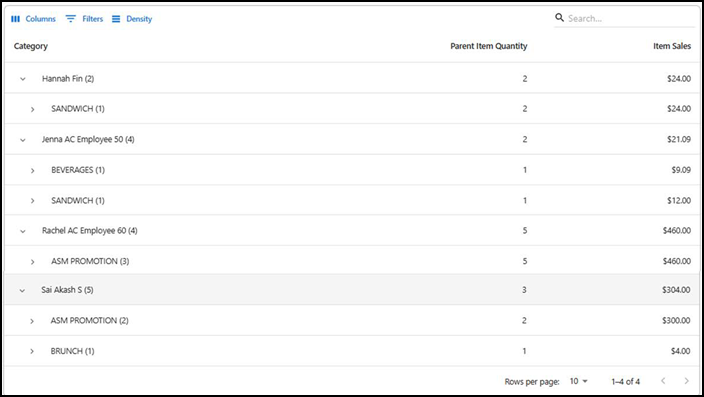
The data in the table appears with the following information:
| Column | Description |
|---|---|
| Category | Category of the item or a modifier. |
| Sold quantity | Total count of the items sold. |
| Item sales | Displays the total amount of item sales. |
To refine your search:
- Select the category of items from the drop-down list. The data appears based on the selected category.
- Select the item from the drop-down list.
- Select the employee from the drop-down list. When the search is refined, the data is generated for the particular selection in that particular date range.
Return to "About sales reporting."