Profit & loss
The 'Profit & loss (P&L)' report summarizes the revenue, costs, and expenses, of the restaurant to gross profit.
To run a 'Profit & loss' report:
-
Select Sales > Report > Profit & loss. The 'Profit & loss' report for the previous day appears by default.
-
Select a site from the drop-down list.
-OR- Click Select all Sites to view report for all sites.
-
Click Reset to reset the site selection.
-
Select a date range
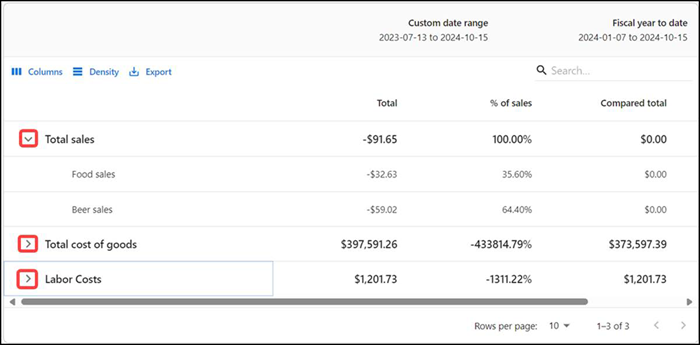
Note: Click the Column options at the top of each column reset or sort the columns. Click the pivot (>) next to each option to sort the data further. You can expand each section to show data by item category.
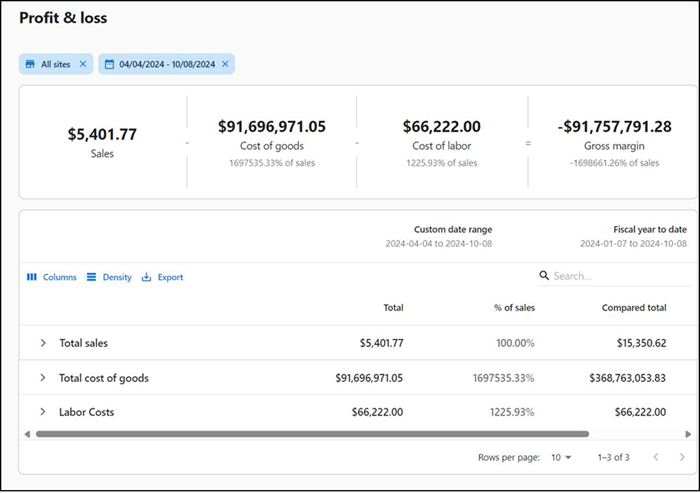
The report dynamically updates with each selected parameter. Reporting data appears on the following tiles:
| Row | Description |
|---|---|
| Total sales | Displays the total and percentage of sales. This is net sales and will break down by sales category as you drill down. |
| Total cost of goods | Displays the total amount the restaurant paid as a cost directly related to the sale of products. This is based on invoices entered and displays cost by category as you drill down |
| Labor Costs | Display the total cost of labor according to the staff working in the restaurant. The report details the wages given to the staff and the total sales. Displays cost of labor and a total as a percent of Net Sales. Displays labor by job code as you drill down. |
| Total | Represents gross profit based on the calculation of sales - cost of goods sold - labor cost. |
| % of sales | Displays the percentage or number of items sold. |
| Compared total | Displays the total compared to the fiscal year. See “Configuring the fiscal calendar” on page 156. |
| Compared % of sales | Displays the percentage of sales compared to the fiscal year. |
Return to "About sales reporting."